The Concept
Qubit Systems is proud to introduce a new concept in teaching photosynthesis in undergraduate laboratories. No more problems with algal systems and O2 electrodes! No more antiquated Warburg paraphernalia! Our Photosynthesis Package measures photosynthetic rate in attached or detached leaves and displays experimental data to your computer screen in real time.
The Photosynthesis Package includes everything you require to conduct numerous experiments investigating photosynthetic physiology. You supply only the computer and the plant! Equipment specifications and experimental designs are fully documented in an Instructor's Manual. A separate Student's Manual guides undergraduates through experimental protocols and data handling. Minimal set-up time is required and experiments are easy to perform.
The PH1LP Package Includes:
A101 Laboratory Stand
A102 Accessories Bracket
A111 Halogen Light Source
A112 Voltage Regulator
A211 Leaf Chamber Accessories Kit
G111 Leaf Chamber
G121 Small Gas Bags
G123 12 Straws
S101 Diffusion Based O2 Sensor
S141 Light Sensor
C410 LabPro Interface
C901 Logger Pro Software
C404 Customized Setup Software
Instructor's and Student's Manuals
Procedure
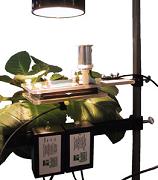
A leaf is enclosed in a transparent chamber incorporating a sensor that measures photosynthetic O2 evolution. Calibration of the O2 sensor requires only that its output be adjusted to read atmospheric O2 level (20.9%). The student fills a gas bag with exhaled air (approximately 17% O2 and 3% CO2) which is then pumped through the chamber. The chamber is then sealed and the leaf illuminated with a halogen light source. Chamber O2 concentration increases as photosynthesis progresses.
Light level may be varied using a voltage regulator control. The light level used in the experiment is monitored by a light sensor situated beneath the leaf chamber. Light sensor output is given in µmol quanta/m2/s and no calibration is required. Analog outputs from both the O2 sensor and the light sensor are converted to digital signals by a LabPro Interface. They are recorded and displayed to the screen using Logger Pro data-acquisition software. The software is also used for subsequent data analysis.
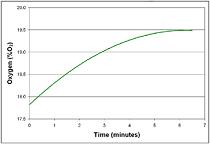
Students can display raw data to screen, or plot any two data sets against each other. For example, the graph below shows the raw data from an experiment in which the leaf chamber O2 concentration is monitored as irradiance is gradually reduced.
Photosynthetic Characteristics


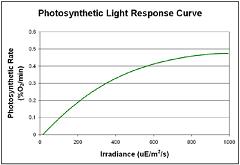
In the following graph, the derivative of O2 concentration against time has been calculated to produce a data set representing photosynthetic rate (%O2 increase per minute). This derivative has been plotted against irradiance to generate a photosynthetic light response curve.

Applications
The Photosynthesis Package is suitable for use in both entry-level undergraduate courses and in research-based upper level courses. The Instructor's Manual provides step-by-step protocols for each experiment. It includes suggested variations to make experiments more, or less, challenging.
Experiments Include:
Photosynthetic rate
Light compensation point
Light saturation point
Photochemical efficiency
Wavelength dependence of photosynthesis
Temperature effects on photosynthesis
Photoinhibition
CO2 limitation of photosynthesis
Comparison of sun and shade plants
Comparison of C3 and C4 species
Producing Area:Canada