Key Features:
Evaluation of Flow Measurements
according to ISO 748
Relational database management system
Online-Registration of measuring values
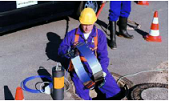


meter type SEBA F1
Velocity-Area Method
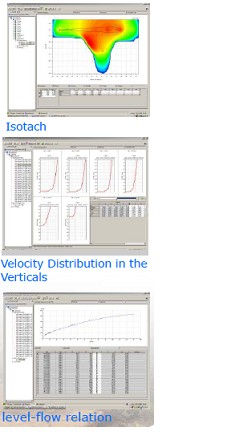
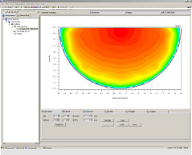
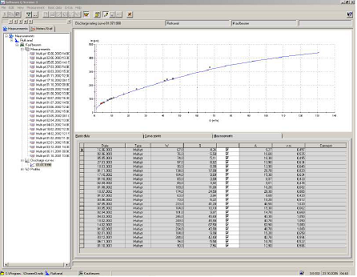
The principle of this method consists of measuring velocity and cross-sectional area. A measuring site is chosen conforming to the specified requirements. The width, depending on its magnitude, is measured either by tape or by some other surveying method and the depth is measured at a number of points across the width, sufficient to determine the shape and area of the cross-section. Velocity observations are made at each vertical preferably at the same time as measurement of depth, especially in case of unstable beds. They are made by anyone of the standard methods using velocity meters. The discharge is computed arithmetically by adding the products of the velocity and corresponding area for a series of observations in a cross-section. Based on the velocity-distribution curves of the verticals, a velocity-distribution diagram for the cross-section is prepared showing lines of equal velocity. Specific regressions in the discharge-rating-curve will be drawn up automatically.
River
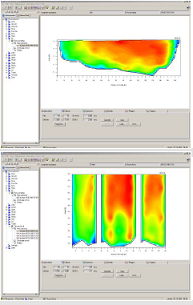
Open Channel
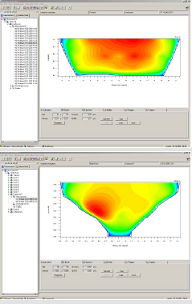
Sewer Pipe
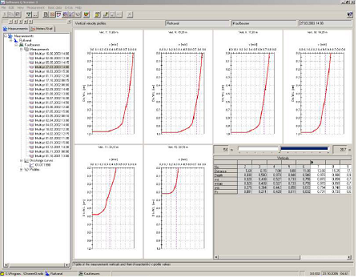
Velocity Distributions in the Verticals
Discharge-Rating-Curve
Supported Methods
One Point Method
Velocity observations shall be made on each vertical by exposing the velocity-meter at 0.6 of the depth below the surface. The value observed is taken as the mean velocity in the vertical.
Two-Point Method:
Velocity observations shall be made at each vertical by exposing the velocity-meter at 0.2 and 0.8 of the depth below the surface. The average of the two values is taken as the mean velocity in the vertical.
Multi-Point Method:
Using this method, the values of the velocity are obtained from observations at a number of points on each vertical between the surface of the water and the bed of the channel. The velocity observations at each position are then plotted and the unit width discharge or mean velocity determined by numerical methods (Spline-Approximation).
Evaluation
For each measurement a record of the measurement is made. The following information is included:
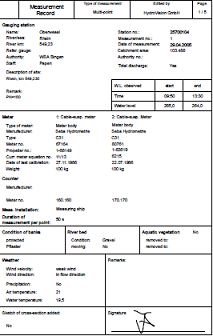
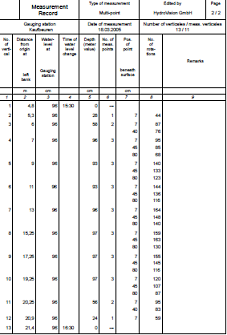
Measurement Record
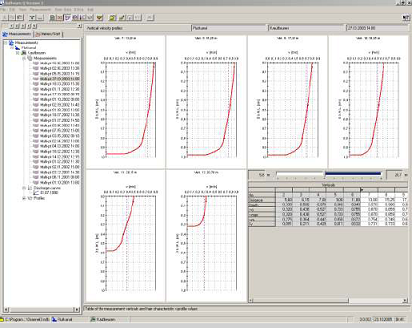
Velocity Distribution in the Verticals
Enhanced Evaluation
With the separately available Profi-Module you can examine even complex flow conditions in much more detail than what the standard version has to offer. The flow distribution in the measuring section is calculated based on the finite-differences-algorithm.
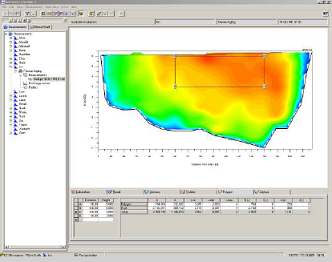
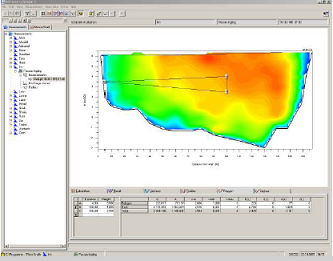
Evaluation of Areas of Interest Hydraulic Calibrations of Sewer Pipes and Open Channel
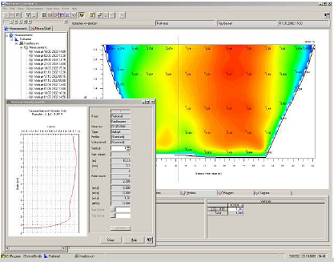
Virtual Vertical and Horizontal Sectional Views
Modules, Interfaces and Upgrade-Options
Interface SEBA HDA
for data exchange between SEBA Qce running on your HDA and Software Q 3.0 installed on your PC/Laptop.
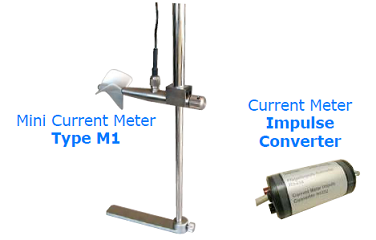
Module Current Meter
for Online-connection of current meter, direct processing and indication of the current meter impulses; requires: impulse converter
Interface for Delphin
online-connection intelligent stabilizer tailpiece, direct processing and indication of the current meter impulses , the flow direction, depth and ground contact
Interface ADC
direct data transfer of measured values of OTT-ADC
Interface for Vota
direct data transfer of measured values of Vota
Interface AGILA
import of ADCP measurements in AGILA format
Module Export
Export of water depths in Aqua-Coup format, Export of point measurements in NVA-, XYK- and WSP file format
Q ce mobile version
SEBA Package incl. impulse converter for the HDA
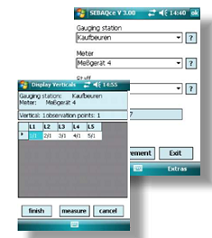
In combination with current meter measurements can be registered and visualized right on your handheld SEBA-HDA. The file-transfer of the data to your PC is done via Software Q 3.0
Our handy HDA combines the function of a signalcounter with the possibility to enter manual notes in one handy, easy and watertight device.
All of your measurements are logged internally in a data base. This makes it possible to continue an aborted measurement at a later time. You can also reload old measurements if necessary.
The measuring points come clearly arranged in form of a data sheet, which makes them very easy to select.
After you have finished your measurement/s, you can easily import the data into Software Q 3.0 and store it in a data base. A professional processing of the taken measurement can be done.
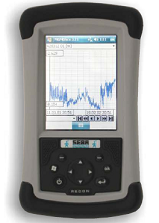
Hydrologica Digital Assistant
SEBA HDA
Producing Area:Germany